
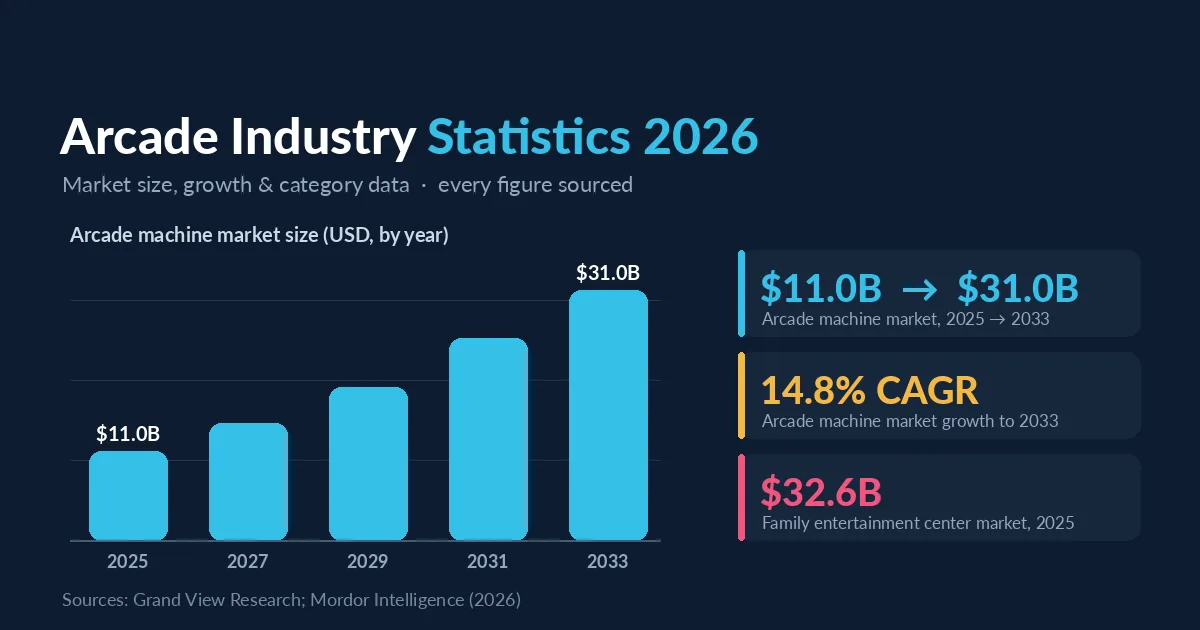
Updated July 2026 — figures are current as of first publication; each figure is attributed to a named research source (see the table below), and this page is refreshed periodically. The arcade machine market stood at about USD 11.0 billion in 2025, per Grand View Research.
How big is the arcade industry in 2026? The global arcade game machines market was about USD 11.0 billion in 2025 and is projected to reach USD 31.0 billion by 2033 — a 14.8% CAGR — per Grand View Research. The wider family entertainment center (FEC) market that buys those machines was roughly USD 32.62 billion in 2025, growing about 6.75% a year toward USD 47.93 billion by 2031, per Mordor Intelligence. Every figure on this page is attributed to a named research source below.
You are writing the business case for a new arcade floor or family entertainment center, and the bank, your partner, or your own board wants numbers that come from somewhere other than your gut. So you search for arcade industry statistics and hit a wall of paywalled report pages, each quoting a different market size with no way to tell which one to trust. This page collects the figures a buyer can actually cite, names the source next to each one, and flags where the research firms disagree — so you can drop a defensible number into your model instead of a guess.
Key takeaways
- The global arcade game machines (equipment) market was about USD 11.0 billion in 2025 and is projected to reach USD 31.0 billion by 2033, a 14.8% CAGR, per Grand View Research.
- The wider family entertainment center (FEC) market — the venues that buy those machines — was roughly USD 32.62 billion in 2025, growing about 6.75% a year toward USD 47.93 billion by 2031, per Mordor Intelligence.
- Redemption games are the single largest machine type by revenue, about 29.2% of the arcade machine market in 2025 (Grand View Research).
- North America is the largest region on both measures; Asia-Pacific is the fastest-growing FEC region at an 8.36% CAGR (Mordor Intelligence).
- IAAPA reports new-equipment orders in 2025 outpaced earlier years in the decade and 2027-plus order books are strong, though operators name tariffs as a capital-spending risk (IAAPA).
Arcade industry statistics: market size at a glance
Two figures get cited most. The global arcade game machines market was about USD 11.0 billion in 2025 (Grand View Research), while the family entertainment center market that operates those machines was roughly USD 32.62 billion (Mordor Intelligence). One counts equipment sales; the other counts venue revenue. Read together they explain the demand behind every container of machines that ships.
The table below is built to be quoted. Each row names the metric, the figure, the year it refers to, and the firm that published it. Where two firms measure the same thing differently, both are shown rather than blended into a single tidy number.
| Metric | Figure | Year | Source |
|---|---|---|---|
| Arcade game machines market (equipment) | USD 11.0B → USD 31.0B by 2033 (14.8% CAGR) | 2025 | Grand View Research |
| Family entertainment center market (venues) | USD 32.62B → USD 47.93B by 2031 (6.75% CAGR) | 2025 | Mordor Intelligence |
| Largest machine type by revenue: redemption games | 29.2% of the arcade machine market | 2025 | Grand View Research |
| Largest FEC region: North America | 34.47% of FEC revenue | 2025 | Mordor Intelligence |
| Fastest-growing FEC region: Asia-Pacific | 8.36% CAGR through 2031 | 2026–2031 | Mordor Intelligence |
| Fastest-growing FEC revenue line: food & beverage | 7.65% CAGR through 2031 | 2026–2031 | Mordor Intelligence |
How big is the arcade machine (equipment) market?
Grand View Research valued the global arcade game machines market at USD 11.0 billion in 2025 and projects USD 31.0 billion by 2033, a 14.8% CAGR. This is the figure that matters to an equipment buyer, because it counts machine sales rather than the tickets a venue sells. Redemption games led every machine type at 29.2% of revenue in 2025.
Under that headline, the mix tells you where the money moves. Redemption formats lead because they pull repeat play through prizes and give operators predictable cash flow, while the simulation and AR/VR category is the fastest-growing type as motion cabinets and headset experiences get cheaper to build. By application, indoor specialty centers led revenue in 2025, and Grand View Research forecasts the U.S. equipment market to grow at a 13.7% CAGR through 2033, driven by location-based entertainment and barcade-style venues. If you are still pricing a first order, our breakdown of factory-direct price ranges by machine category pairs naturally with these market numbers.
FEC market size, growth, and revenue mix
Mordor Intelligence puts the family entertainment center market at USD 32.62 billion in 2025, rising to USD 47.93 billion by 2031 at a 6.75% CAGR. Inside a venue, entry fees and ticket sales drive 44.23% of revenue, and food and beverage is the fastest-growing line at a 7.65% CAGR, income a venue earns from several tills at once.
The segment splits are useful when you plan a mix. Skill and competition games (bowling, laser tag, karting, plus arcade and redemption zones) made up the largest activity area at 40.21% of FEC revenue in 2025, and children’s entertainment centers were the biggest venue type at 35.83%. The market is also fragmented: Mordor notes the top five operators together held only about 24% of global revenue in 2025, which is why regional and independent venues remain the bulk of equipment demand. Growth-rate estimates do differ by firm — Technavio, for example, models roughly USD 31.88 billion of FEC growth between 2024 and 2029 — so cite one source per number rather than stacking them. To turn the redemption share into a floor plan, see how to plan a redemption machine mix for a new FEC.
Which regions are growing fastest?
North America is the biggest market on both measures — 39.3% of arcade machine revenue (Grand View Research) and 34.47% of FEC revenue in 2025 (Mordor Intelligence). Asia-Pacific is the fastest-growing FEC region at an 8.36% CAGR through 2031, driven by urbanization, rising middle-class spending, and mall-based leisure across China, India, South Korea, and Southeast Asia.
On the supply side, IAAPA’s Q3 2025 industry outlook reports that manufacturers saw new-equipment orders outpace earlier years in the decade, with order books for 2027 and beyond described as strong. The same report flags tariffs and trade policy as a live concern for operators planning capital spending. For an importer, that points toward ordering earlier rather than later, though it also means landed cost deserves careful modeling; our guide to what tariffs and freight add on top of the factory price walks through it, and any duty or compliance question should be confirmed with your own customs broker.
How to use these numbers (and common mistakes)
Use these arcade industry statistics to size a business case, not to promise a return. A market-size figure shows the category is growing; it says nothing about what one machine earns on your floor. For that you still model your own footfall, price per play, and mix. The most common mistake is quoting the wrong market entirely.
Market-level numbers do not size a single venue. To turn them into something you can take to a landlord or a lender, run your own floor area, ticket price and footfall through our free arcade and FEC ROI calculator — it models machine count and payback from your inputs, not from industry averages.
Watch for these traps before a number lands in your deck:
- Confusing the equipment market with the venue market. The USD 11.0 billion machine figure and the USD 32.62 billion FEC figure are not interchangeable; one is what suppliers sell, the other is what operators earn.
- Stacking numbers from different firms. Each research house uses its own market definition and base year, so blending a Grand View figure with a Mordor one produces a total that means nothing.
- Treating a CAGR as a guarantee. A 14.8% projected growth rate is a forecast, not a floor; your local market can move differently.
- Citing a headline without the year and region. Always carry the “as of 2025” and the geography with the number, because both change the figure.
Used well, these figures do real work: they anchor the market-opportunity slide in an investor deck, support a site-selection memo, and give a lender third-party context for an equipment loan. When you reach the line item for the machines themselves, our worked example of real claw machine payback numbers shows how a single category converts footfall into revenue, and you can browse commercial redemption machines or VR arcade machines to match the fastest-growing categories above.
FAQ
How big is the arcade industry in 2026?
It depends on what you count. The global arcade game machines (equipment) market was about USD 11.0 billion in 2025 per Grand View Research, while the broader family entertainment center market that operates those machines was roughly USD 32.62 billion in 2025 per Mordor Intelligence.
Is the arcade and FEC market growing or declining?
Growing, on current forecasts. Grand View Research projects the arcade game machines market to expand at a 14.8% CAGR to 2033, and Mordor Intelligence projects the FEC market to grow at a 6.75% CAGR to 2031. Both are forecasts, so treat them as direction rather than a promise.
Which arcade machine category makes the most money?
By revenue share, redemption games led all arcade machine types at 29.2% in 2025, according to Grand View Research. Redemption formats earn through repeat, prize-driven play, which is why operators lean on them for predictable cash flow.
Which region is the biggest market for arcade machines?
North America held the largest share in 2025 — 39.3% of the arcade machine market (Grand View Research) and 34.47% of the FEC market (Mordor Intelligence). Asia-Pacific is the fastest-growing FEC region at an 8.36% CAGR through 2031.
Put these numbers behind a real order
Building the equipment line of a business case or investor deck? Send us your venue size, target market, and the machine categories you are weighing, and we will put together an indicative, factory-direct quote you can drop straight into your model. Request a factory-direct equipment quote and tell us your destination port so the numbers reflect your project.